


If the question is "will Sentry tell me why my app broke in production and help me fix it," the short answer is yes for the first part and increasingly yes for the second. Sentry captures unhandled errors with full stack traces the moment they happen, ties them to the release and the commit that likely introduced them, and its Seer AI layer will now attempt a root cause explanation and even a merge-ready patch. Whether the AI portion earns its extra cost depends on your codebase and your tolerance for reviewing machine-suggested fixes, which is the more interesting part of this review.
What Sentry actually does
At its core, Sentry is error tracking. When your application throws an exception, the SDK grabs the stack trace, the surrounding breadcrumbs (the sequence of events leading up to the failure), the release version, and environment context, then groups similar occurrences into a single issue so you are not drowning in ten thousand copies of the same bug. This grouping is the quiet workhorse feature: without it, a spike in a common error would bury everything else. Source map support means the stack traces you see for minified JavaScript point at your real source lines rather than an unreadable single-line blob.
Around that error core, Sentry has expanded into a broader monitoring platform. According to the vendor's product pages, it now covers:
- Tracing and performance - distributed traces that follow a request across services, surfacing slow database queries, N+1 query patterns, and request timeouts. This is where you diagnose "the app is slow" complaints that never throw an error.
- Session Replay - a reconstruction of what the user did in the browser before a crash, so you can see the click path instead of guessing from a bug report.
- Logs - aggregated log data connected to the same trace as your errors and spans.
- Profiling - runtime performance analysis to find hot code paths.
- Cron and Uptime monitoring - checks that scheduled jobs actually ran and that endpoints stay reachable.
The unifying idea Sentry emphasizes is that errors, logs, replays, spans, profiles, and metrics are all connected by the same trace. In practice that connection is the payoff: when you open an error, you can pivot to the slow span that preceded it or the replay that shows the user rage-clicking, without stitching data together by hand across separate tools.
The AI layer: Seer and Autofix
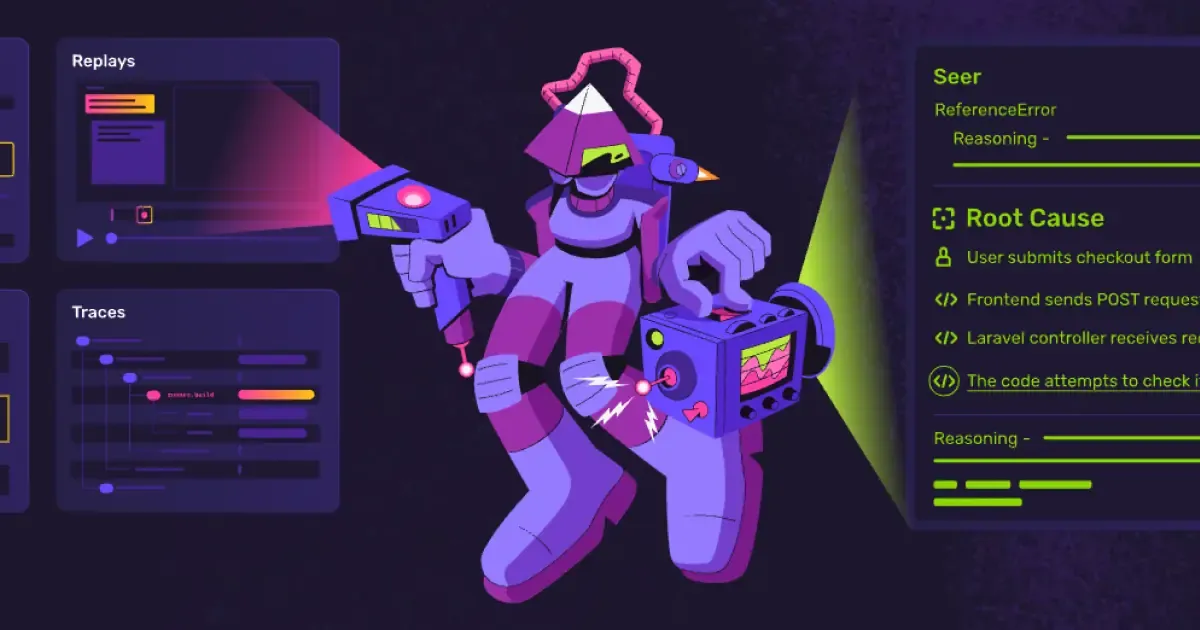
Sentry's newer differentiator is Seer, its AI debugging agent. Per the vendor, Seer performs automated root cause analysis by reasoning over trace data, logs, and recent commits, and its Autofix capability generates what Sentry calls "merge-ready patches" for identified issues. There is also an AI code review element aimed at predicting errors before they reach production.
The realistic way to think about this: Seer is most useful on errors where the cause is mechanical and traceable, a null reference tied to a recent code change, a regression a specific commit introduced. It is far less trustworthy on architectural or race-condition bugs, where a confident-sounding patch can be wrong in subtle ways. Treat Autofix output as a well-informed first draft from a junior engineer who has read your stack trace, not as something to merge unread. Used that way it can genuinely shorten triage; used carelessly it invites regressions. Note also that Seer is a paid add-on that requires a subscription even on the entry paid tier, so it is not simply "included."
Who this is a good fit for
Sentry is aimed at software engineering teams, DevOps engineers, and SREs who run code in production and need to know quickly when it misbehaves. It earns its place fastest for teams shipping web and backend services on a modern stack, because the SDK does most of the setup work and the GitHub, GitLab, and Jira integrations let an error create or link a ticket without a context switch.
It fits less well for a solo developer on a low-traffic hobby project who could read their own server logs, or for organizations that are purely infrastructure-monitoring focused and want host metrics and dashboards rather than code-level error detail. Sentry answers "which line of my code failed and why," not "is my Kubernetes cluster healthy." If you need the latter, Sentry is a complement, not a replacement.
Sentry's platform page lists SDKs across a broad set of languages and frameworks, including Next.js, Angular, Python, Node.js, React, Go, Swift, Ruby, PHP, and Java, alongside mobile targets like iOS, Android, React Native, and Flutter. That range covers the majority of common web and mobile stacks; if you work in a niche language, confirm SDK coverage before committing. You can compare it against other options in our AI debugging tools category.
What it costs
Sentry uses a freemium, usage-based model. The free Developer plan is genuinely usable for one person: it includes 5,000 errors, 5 million tracing spans, 50 session replays, and 10 custom dashboards per month, with email alerts. The prices below are as listed on Sentry's pricing page at the time of writing on annual billing, and usage above the included quotas is billed separately.
| Plan | Price (annual) | Users | Included quotas / notable features |
|---|---|---|---|
| Developer | $0 | 1 | 5k errors, 5M spans, 50 replays, 10 dashboards, email alerts |
| Team | $26/mo | Unlimited | 50k errors, third-party integrations, metric monitors, Seer AI (subscription required) |
| Business | $80/mo | Unlimited | Unlimited dashboards, anomaly detection, advanced quota management, SAML + SCIM |
| Enterprise | Custom | Unlimited | Technical account manager, dedicated support, custom configuration |
The catch to plan for is the add-on pricing. Sentry lists extra logs and metrics at $0.50/GB, UI profiling at $0.25/hr, continuous profiling at $0.0315/hr, uptime alerts at $1.00 each, and cron monitors at $0.78 each. None of these are large in isolation, but a high-traffic service with generous replay sampling and profiling enabled can push a bill well past the base plan price. Set sampling rates and quota alerts deliberately rather than leaving everything at default, or the usage-based model will surprise you at the end of the month.
Strengths worth weighing
- Fast time-to-value: drop in the SDK and you get grouped, stack-traced errors almost immediately, with source maps making front-end traces readable.
- Correlated telemetry: errors, traces, replays, and logs share a trace ID, which shortens the path from symptom to cause.
- Broad platform coverage across many languages and frameworks, spanning web, mobile, and backend.
- A free tier that is realistically useful for individuals and small projects, not just a demo.
- Workflow integrations (GitHub, GitLab, Jira, Slack, Linear, CI/CD) that keep triage inside the tools teams already use.
- The core SDKs are open source, which matters for teams that want to inspect or self-host components.
Drawbacks and honest caveats
- Cost is usage-based and add-on heavy; without quota management, replays and profiling can inflate the bill quickly.
- Seer AI is a paid add-on requiring its own subscription even on the Team plan, so the AI story is not free even after you pay for a plan.
- Autofix output needs human review; merge-ready is a claim about format, not a guarantee of correctness, and confident wrong patches are the real risk.
- SAML and SCIM sit on the Business tier, so organizations needing enterprise SSO cannot get it on the cheapest paid plan.
- It is application monitoring, not infrastructure monitoring; expect to run something else alongside it for host and cluster health.
The verdict
Sentry is a mature, well-scoped tool that does the unglamorous job of production error tracking very well, and has layered credible tracing, replay, and AI-assisted debugging on top. For an engineering team that ships often and needs to know within seconds when a release breaks, the value proposition is straightforward and the free tier lets you prove it on a real project before paying. The two things to decide deliberately are budget and trust: model your event and replay volume against the usage-based pricing so the add-ons do not blindside you, and treat Seer's fixes as reviewable drafts rather than autopilot. Judged as an error-monitoring platform it is a strong default; judged as an AI that fixes your bugs unattended, temper expectations. Browse related options in our tools directory if you want to compare before committing.
Common questions about Sentry
Does Sentry have a free plan?
Yes. The Developer plan costs $0 and supports one user with 5,000 errors, 5 million tracing spans, 50 session replays, and 10 custom dashboards per month, plus email alerts. It is suitable for individuals and small projects.
What is Seer and is it included?
Seer is Sentry's AI debugger. Per the vendor it performs automated root cause analysis using trace data, logs, and commits, and its Autofix feature generates merge-ready patches. It is available on paid plans but requires its own subscription, so it is an add-on rather than a bundled feature even on the Team plan.
How many languages and frameworks does Sentry support?
Sentry's platform page lists a broad set of languages and frameworks, including Next.js, Angular, Python, Node.js, React, Go, Swift, Ruby, PHP, and Java, plus mobile targets such as iOS, Android, React Native, and Flutter. Check the platforms page for a specific SDK before committing.
What does Sentry monitor beyond errors?
Beyond error tracking, Sentry offers tracing and performance monitoring, session replay, logs, profiling, and cron and uptime monitoring, all connected through a shared trace.
Why can the bill grow beyond the plan price?
Pricing is usage-based. Sentry lists add-on costs such as $0.50/GB for extra logs and metrics, $0.25/hr for UI profiling, $0.0315/hr for continuous profiling, $1.00 per uptime alert, and $0.78 per cron monitor, so high volumes can exceed the base plan cost unless you manage quotas and sampling.